Surprising Facts about Plastic (Production, Use, and Recycling - Global Data 2022)
Posted by Rob Errera on 04/04/2022
")
Plastic is everywhere. From car parts to candy wrappers, plastic became an integral part of human existence.
But, in recent decades, there’s rising awareness of the impact of plastic on our environment. We still have a long way to go, but the pressure on industries to increase the rate of recycling and reuse is growing and showing results.
Let’s take a look at some of the latest facts about plastic production, use, and recycling rates.
Global Plastic Industry Facts and Statistics
- The world plastic market's estimated worth in 2020 was 580 billion US dollars.
- It’s estimated that 367 million metric tons of plastic were produced globally in 2020.
- The world produced 0.3 percent less plastic in 2020 than in 2019 due to the implications of COVID-19.
- In 2019, we produced 32% more plastic (368 million tons) than in 2009 (250 million tons) – an increase of 118 million metric tons.

Source: Research Gate
- 19% of plastic in the world is produced by The North American Free Trade Agreement (NAFTA) which includes Canada, the US, and Mexico.
- China is by far the biggest producer of plastics at 32% of the market. On average, China produces 6-8 million tons of plastic per month.
- The value of plastic products China exported in 2019 is estimated at 48.3 billion US dollars. Out of the total of 75.3 million tons produced that year in China, 14.2 million tons of plastic were exported to other countries.
- By 2015, the world cumulatively produced over 7 billion tons of plastic. By 2021, that number surpassed 8.7 billion tons.
- 49 million tons of thermoplastic resin were sold in the US in 2020. Out of that, 31% was used for product packaging.
- Plastic takes 8th place among the biggest manufacturing industries in the US, providing more than 1 million jobs. Most plastic production in the US is situated in California, Michigan, Texas, and Ohio.
- The packaging sector accounts for 35% of all plastic production worldwide. The building and construction industry uses 16% of world's plastic, and textiles account for another 14.5%.

Source: Our World in Data
Stats and Facts about Plastic Recycling
From single-use foam drinking cups, ceiling fan blades, to airplane parts, plastics are everywhere. While plastic can be divided into 7 groups, the truth is that sometimes different materials are mixed and matched to maximize the quality of products.
This practice makes plastic waste recovery and sorting a challenge – yet careful sorting is necessary for proper recycling. In addition, the value of plastic recovered from recycling processes is low.
These challenges make recycling more expensive than generating new plastic. That’s why recycling rates still aren’t very high, despite the growing pressure from scientists, ecologists, and the public.
- 3,090,000 tons of plastics were recycled in the US in 2018. By contrast, 26,970,000 tons were dumped in landfills.

Source: United States Environmental Protection Agency
- Only 13.6%of plastic packaging was made out of recycled plastic in 2018 in the US. In total, 2 million tons of plastic were reused that year in the packaging industry.
- According to the EPA, only 9%of the plastic generated across industries in the US is recycled.
- Around 70% of plastic generated in the US ends up in landfills.
Used gadgets, packaging, clothing, and toys - throwing them in the landfill creates various problems. Plastic in landfills slowly disintegrates and becomes microplastic.
- All pieces of plastic less than 5 mm (0.2 inches) long are categorized as microplastic.
The tiny pieces of plastic easily seep into the ground and nearby bodies of water. Plastic doesn’t only pollute our ground and water, but it also harms marine life, and by extension, people.
Microplastic was found inside coral tissue, but also in human blood. These discoveries may have dire consequences.
A 2018 study showed that 52% of sea turtles ingested plastic at some point – which can be fatal for them and many other marine life forms.
How Different Types of Plastic Compare
All plastics are polymers – substances with long repeating chains. But not all polymers are plastics. This group of chemicals also includes cellulose, rubber, and more.
The plastics we use today are divided into 7 groups labeled with SPI codes. An SPI number is likely molded somewhere on your plastic object.

- Synthesizing plastic for use takes a lot of energy – between 62 and 108 megajoules per kilogram. Silicone is notoriously costly to produce at 235 megajoules per 1 kg.
- Additives are used to achieve good properties like flexibility, heat resistance, or color. About 25 million tons of additives for plastic are produced per year globally.
1. PET or PETE - Polyethylene Terephthalate
- Often used for product and food packaging, including single-use water and soda bottles, containers for mouthwash, salad dressings, soaps and detergents, and many other products.
- About 33 million tons of PET are produced each year worldwide – and the share of PET in the global plastic market is 25%.
- Used as packaging because it prevents all air from getting in or out and spoiling your food or drink.
- Suitable for single-use only. Using PET bottles repeatedly increases the risk of harmful chemicals leaching into your drink.
- About 29% of PET bottles end up recycled in the US. In 2018, the United States recycled a total of 910,000 tons of PET.

2. HDPE – High-Density Polyethylene
- HDPE can withstand temperature changes, so it’s often used for opaque fuel canisters, medicine and shampoo bottles, bottle caps, and milk jugs. Due to its resilience, it’s also used for objects often exposed to the sun, like park benches, picnic tables, and bed liners for trucks.
- In 2020, HDPE constituted 21% of all thermoplastic resins sold in the US.
- Easily recyclable and safe for reuse. Annually, the US recycles between30 and 35% of generated HDPE plastics.
- About 52 million tons of HDPE are produced globally each year.

3. PVC or V – Polyvinyl Chloride
- Used for blister packaging, medical tubing, sheathing for cables, garden hoses, window and door frames, and plastic parts of plumbing pipes.
- Vinyl is often made with PVC as the main ingredient, but the two are not exactly the same.
- PVC is widely used, despite being potentially highly toxic for humans, animals, and the environment.
- It’s fairly easy to print on.
- Approximately 38 million metric tons of PVC are produced worldwide on a yearly basis.
- Less than 1% of PVC is recycled. Most products require “virgin” material for maximum performance.

4. LDPE or PE-LD – Low-Density Polyethylene
- This flexible polyethylene is used for plastic bags, frozen food bags, shrink wraps, food storage containers and lids, as a coating for juice cartons, and wire and cable coverings.
- Globally, about 64 million tons of LDPE are produced per year.
- It’s very hard to recycle. Less than 10% of LDPE is recycled in the US, making LDPE bags and containers a common sight in landfills.

5. PP – Polypropylene
- This versatile plastic is used in many industries. Its uses include bottle caps, disposable diapers and sanitary pads, potato chips and cereal bags, plastic straws and rope, thermal vests, transparent toothbrushes, prescription bottles, and car bumpers.
- The most widespread type of plastic in the world – 68 million tons are generated every year.
- However, only about 3% of all PP is recycled in the US. The recycled material is fit for items like battery cases, brooms, and trash cans.

6. PS – Polystyrene
- The foam plastic. Styrofoam is a branded type of polystyrene. Used for disposable drinking cups and plates, clamshell containers for take-out food, egg cartons, and foam insulation in home construction.
- The world generates around 25 million tons of PS yearly.
- It’s hard to recycle, so this material makes up as much as 35% of all waste in US landfills. For comparison, paper makes up 26% of the waste.

7. O – Other Plastics
The SPI number 7 is used as an umbrella category for many other kinds of plastic, most of which are not recyclable. It includes plastics like epoxy, polycarbonate, acrylics, fiberglass, nylon, and others. They’re often created and sold as resin.
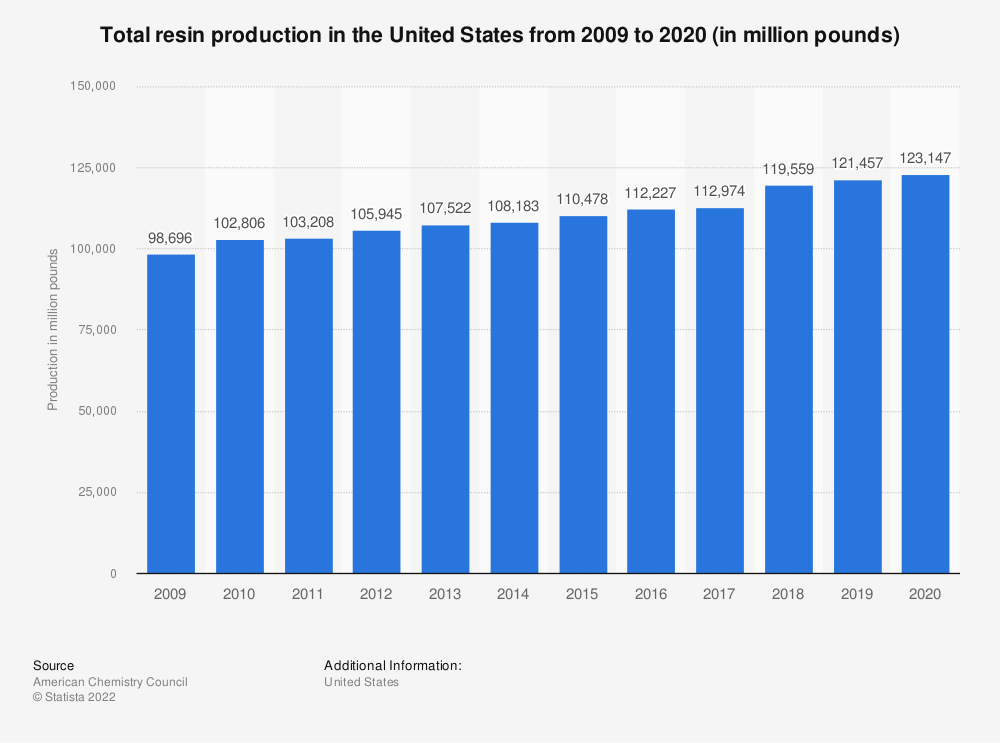
- The market for resins is growing. In total, the US produced 55.7 million metric tons of resin in 2020. That's a 19% increase from 2010, when production was estimated at 46.6 tons of resin.
- Out of all plastic resins produced, 13% were thermoset polymers - materials like polyester, silicone, epoxy, and polyurethane. These heat-resistant materials are generally not recyclable.
- Thermoplastics (PVC, HDPE, PP, and nylon) were a staggering 87% of production.
Source: Statista
The Path to Sustainable Plastic Production
It’s our responsibility to either recycle or replace everyday plastic products with sustainable alternatives. That’s especially important for short lifespan and single-use items.
Starting with reusable grocery bags and moving towards better industrial practices, we can:
- replace non-recyclable materials with sustainable alternatives, and
- improve recycling rates and create innovative ways to repurpose materials.
Plastic is both useful and harmful, and fortunately, the world is turning to more sustainable use and disposal.
- According to a 2022 report, the global plastic recycling market is expected to grow quickly - they forecast that the $44.3 billion recycling industry will reach a value of $76.5 billion by 2028.
That’s great news! Rising awareness among consumers, governments, and industry leaders is leading to a less polluted future.
We don’t know how to reverse the damage already done, but we’re actively working on making Earth a cleaner place to live.
Further Reading:
- Deforestation Facts and Statistics 2022 [Global Data]
- Staggering E-Waste Facts & Statistics 2022
- Eye-Opening Work-Life Balance Statistics [2022]
- How Many Books Are Published Each Year? [2022 Statistics]
https://www.science.org/doi/10.1126/sciadv.1700782
https://www.plasticsindustry.org/sizeandimpact
https://www.statista.com/statistics/282732/global-production-of-plastics-since-1950/
https://ourworldindata.org/grapher/plastic-production-by-sector
https://www.epa.gov/facts-and-figures-about-materials-waste-and-recycling/plastics-material-specific-data
https://link.springer.com/article/10.1007/s11356-021-13240-x
https://www.sciencedirect.com/science/article/pii/S0160412022001258
https://onlinelibrary.wiley.com/doi/abs/10.1111/gcb.13078
https://www.cfs.gov.hk/english/programme/programme_rafs/programme_rafs_fc_02_16.html
https://www.statista.com/statistics/203398/total-us-resin-production-from-2008/
https://www.blueweaveconsulting.com/report/global-plastic-recycling-market-bwc19133

Rob Errera
Rob Errera is an award-winning journalist embedded in the world of printers and printing supplies. Rob has nearly two decades of experience writing about cutting edge technology, business trends, and the ever-evolving industry of printing.