Calculating arrival date


Staggering E-Waste Facts & Statistics 2024
10/19/2023

At a Glance: E-Waste Facts and Stats
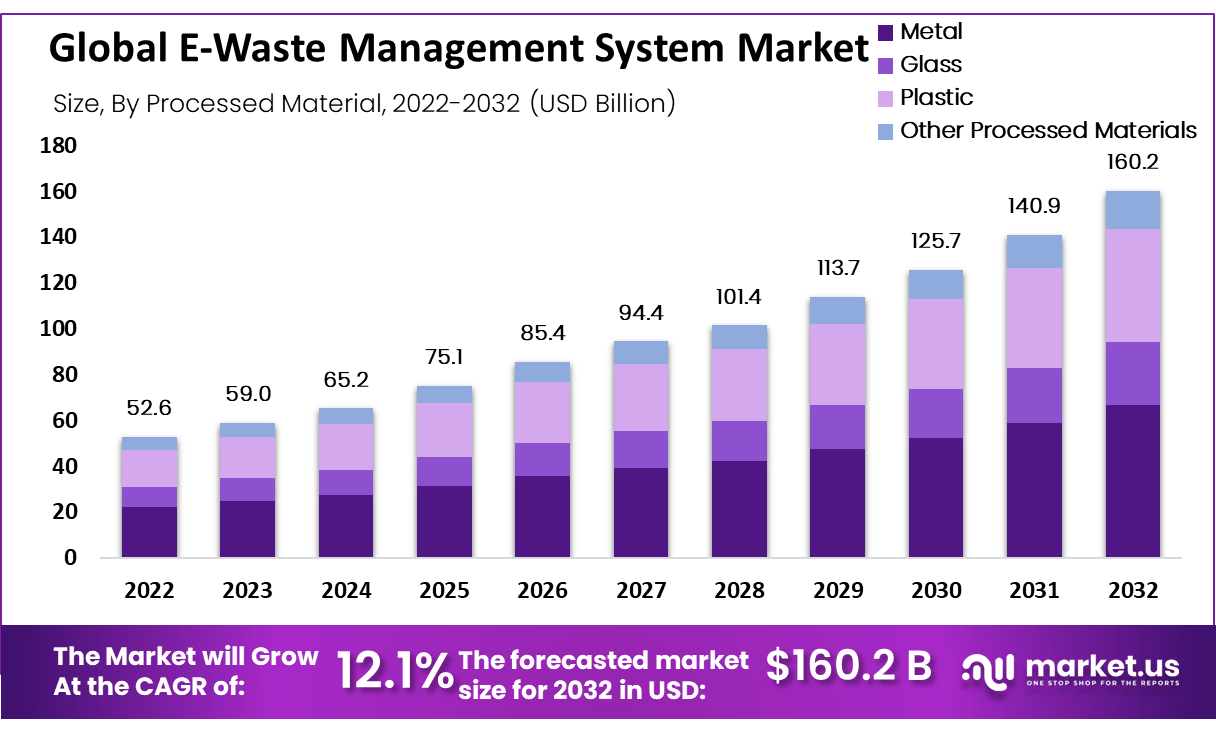
- In 2022, the global e-waste market was worth USD 52.6 Billion. It's expected to reach USD 160.2 Billion by 2032.
- Back in 2019, the world already produced 54 million metric tons of e-waste. By 2030, this number is expected to surge to approximately 74.7 million metric tons, reflecting a 30% increase.
- Asia made the most e-waste in 2019 with 24.9 million tons. After Asia, the Americas and Europe made the most, with Africa and Oceania making the least.
- The 2021 Pirg report states that American families spend an average of $1,767 on new electronic products annually.
- Meanwhile, in Europe, Norway stands out: individuals there dispose of approximately 26 kilograms of e-waste per person, with electric car batteries contributing to this statistic.
What are you reading this blog on? A phone, laptop, or tablet?
When you’re ready for an upgrade what happens to this device?
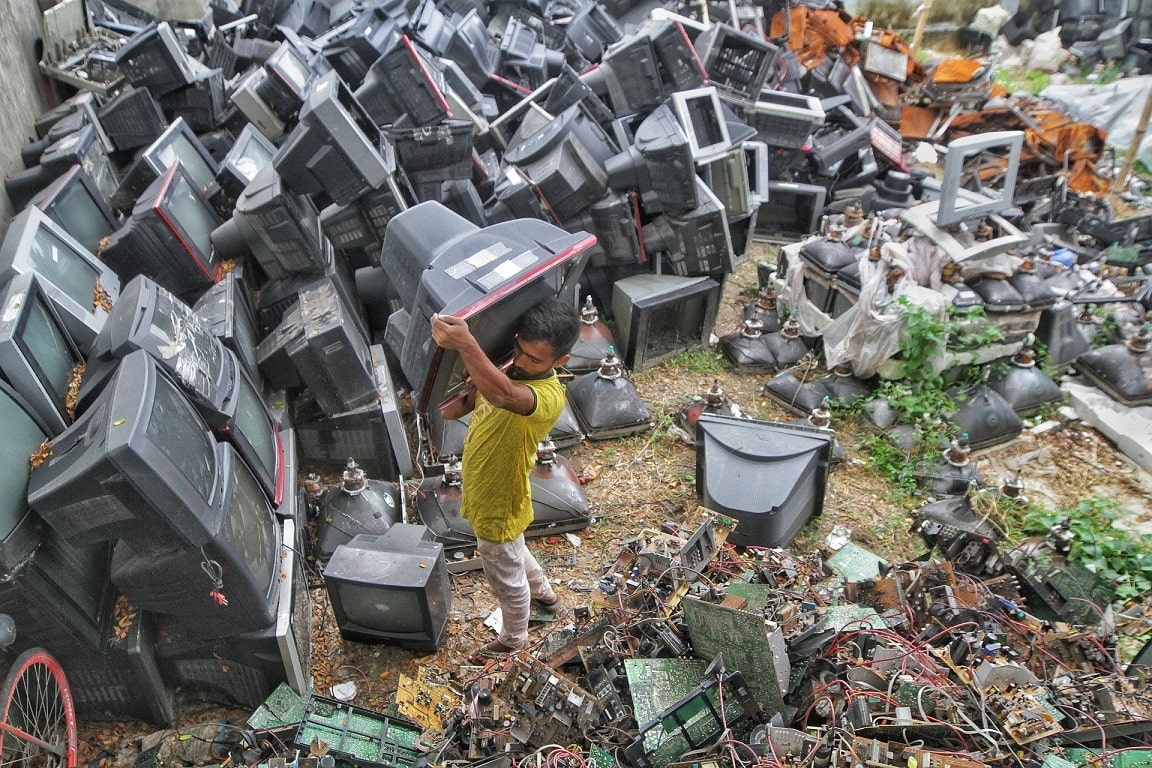
E-waste, or electronic waste, is a term used to describe discarded electronics. And with the proliferation of electronic devices e-waste has become a serious environmental and health problem facing the world.
☝
Did you know?
- In 2019 the e-waste output of the world weighed the equivalent of 350 cruise ships. Today, it's estimated to be 25 more - 375 cruise ships.
- If you placed all the year’s e-waste in a line it would be
77 miles long.
- Driving on a highway it would take
over an hour to get to the end.
- The US alone produced
6.92 million tons of e-waste in 2019, roughly 46lbs per person.
So how often do you discard outdated or unwanted electronic devices?
And what do you do with them when you do?
General E-Waste Facts & Stats
Here are some truly shocking e-waste statistics to highlight the need for proper e-waste recycling:
- The global e-waste management system market was valued at USD 52.6 Billion in 2022 and is projected to reach around USD 160.2 Billion by 2032.
Global E-Waste Management System Market Size
- From 2014 to 2019, global e-waste saw an increase of 21%.
- In 2019 alone, 54 million metric tons of e-waste was generated, and this is projected to rise to 74.7 million metric tons by 2030, marking a 30% increase.
- Looking at individual contributions, in 2019, the average global citizen produced 7.3 kilograms of electronic waste. This number is expected to rise to 9 kilograms by 2030.
So what makes e-waste worse than other forms of waste?
Many of the materials required to make electronic devices work are toxic and hazardous and need proper disposal to ensure they don’t pose a risk to people’s health and the environment.
Around the World in E-Waste Statistics
- Asia produced the largest volume of e-waste in 2019 (24.9 million tons), followed by the Americas (13.1 million tons), Europe (12 million tons), Africa (2.9 million tons), and Oceania (0.7 million tons).
- While Asia leads the way in total e-waste, per capita Europe produces the most at 35.6lb per person, Oceania ranks second (35.4lb), then the Americas (29.2lb), Asia and Africa were much lower at 12.3lb and 5.5lb respectively.
- Electronic waste generation varies significantly across countries, both in total volume and on a per capita basis. In 2019, China emerged as the largest producer of electronic waste, amassing a total of 10.1 million tons.
- Yet, on a per capita basis, China's contribution is modest at 7.2 kilograms per person, which is considerably lower than many other nations.
- For instance, many European and Anglo nations generate over 20 kilograms per individual each year.
- Among them, Scandinavian countries stand out.
- Norway, influenced by its use of electric car batteries, leads with 26 kilograms per capita.
Top Countries Producing the Most E-Waste Per Capita in 2019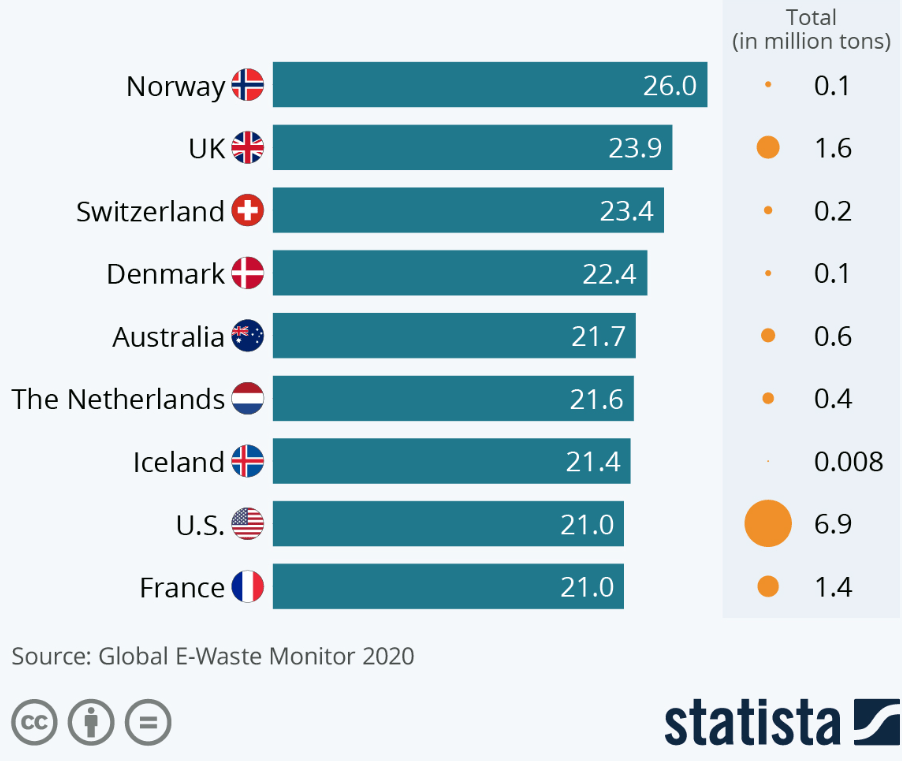
- The UK isn't far behind, producing nearly 24 kilograms per person.
- Meanwhile, both Australia and the U.S. are in a similar range, each generating between 21 and 22 kilograms of e-waste per capita annually.
- While per capita developed nations produce the most e-waste, roughly 70% to 80% of global e-waste is shipped to landfill sites in developing nations, where it is sorted and sold or burned to extract materials.
- In 2019, between 2.4 million tons and 9.7 million tons of e-waste were shipped to developing countries.
- The world’s largest e-waste dump is Agboglshie, an area in Ghana’s capital Accra. The site receives over 225,000 tons of e-waste each year.
Recycling E-Waste Statistics We Need To Improve
The only way out of the world’s current e-waste crisis is to recycle our electronic devices better and develop safer e-waste recycling methods.
- However, in 2019 only 17.4% of discarded electronic devices were appropriately recycled.
- For every million cell phones recycled, we could recover 35,274lb of copper, 772lb of silver, 75lb of gold, and 33lb of palladium.
- For every million laptops recycled, we could save energy equivalent to the electricity consumed by more than 3,500 homes in a year.
- Per weight, recycling circuit boards contain more valuable material than mining for ore. Circuit boards have 40 to 800 times more gold than ore and 30 to 40 times more copper than ore.
⚡
What percent of e-waste is recycled?
Today, only about
20% of all e-waste produced is officially recycled.
- Not all e-waste recycling is the same. Many companies export the waste to developing countries without monitoring the health and human safety standards used.
- Europe leads the world in e-waste recycling at 42.5% for 2019, with Asia (11.7%) and the Americas (9.4%) lagging behind.
US E-Waste Statistics
As you might expect, the US is one of the leading producers of e-waste, second only to China.
Amount of E-Waste Generated in the US
| Year | E-waste | Collection Rate | EEE Put on Market | Formally Collected |
| 2016 | 6618 kt | 16% | 7536 kt | 1070 kt |
| 2017 | 6721 kt | 15% | 7915 kt | 1020 kt |
| 2018 | 6817 kt | 15% | 7745 kt | 1020 kt |
| 2019 | 6918 kt | 15% | 8354 kt | 1020 kt |
- The US only recycled 15% of its e-waste in 2019.
- The value of raw materials in e-waste generated by America in 2019 is estimated to be almost $7.5 billion.
- Estimates suggest 40% of heavy metals in US landfills come from discarded electronics.
- Currently, 15% of gold, 15% of silver, and 5% of platinum found in e-waste are recycled. If this reached 100%, it would generate an additional $12 billion.
- In 2014 figures indicate Americans threw out roughly 416,000 cell phones each day. That totals more than 151 million phones in a year.
- According to the 2021 report by Pirg, American households spend an average of $1,767 on new electronic products annually.
- Compared to the 2019 data, this represents a $287 increase, marking a 19% rise in just two years, even though many electronics have seen price reductions.
- The same report notes that each American household, on average, possesses 24 electronic items.
How To Fix the Massive E-Waste Problems
The Effect E-Waste Has on the Environment
E-waste can affect the environment in 3 major ways:
- Air contamination – dismantling, shredding, or melting e-waste materials releases dust particles into the air that cause increased pollution and respiratory damage.
- Soil Contamination – improperly disposing of e-waste in landfills allows heavy metals and flame retardants to seep directly into the soil.
- Water Contamination – Once in the soil, heavy metals can leak into the groundwater, causing more damage through acidification and toxification.
E-waste damages the environment by releasing greenhouse gases, harming wildlife and their habitats, and negatively affecting human health.
- In 2019 an estimated 98 million tons of carbon dioxide equivalents was released into the atmosphere from the refrigerator and air conditioner e-waste alone. This contributed roughly 0.3% of global greenhouse emissions for 2019.
- In order to manufacture a single computer and monitor, it requires 500lb of fossil fuels, 1.5 tons of water, and 50lb of chemicals.
- The 17.4% of e-waste recycled in 2019 prevented 13.6 million tons of carbon dioxide equivalents from being released into the environment.
The Health Consequences of E-Waste
Most importantly, e-waste is tremendously damaging to the health of the people living or working in or around e-waste recycling sites.
It is especially unfortunate to think that much of the developed world is shipping their e-waste to developing countries, damaging people’s health who have far less access to the upsides modern technology has to offer.
- E-waste has the potential to expose people to over a thousand harmful substances. These include nickel, lead, and mercury.
- Research has shown a connection between many health effects and exposure to e-waste. These include a change in thyroid function, cellular expression and function changes, adverse neonatal outcomes, changes in temperament and behavior, and decreased lung function.
- Workers recovering materials from e-waste are at an increased risk of stillbirths, premature births, and spontaneous abortions. Children of these workers have been shown to have reduced birth weights and birth lengths.
- People living in or near e-waste recycling towns have shown evidence of greater DNA damage.
- In the informal industrial sector, of which e-waste processing is a sub-sector, there are estimated to be more than 18 million children/adolescents currently working. Exposure to the toxic chemicals in e-waste is especially damaging to children due to their smaller size, less developed organs, and rapid growth and development.
What Can We All Do To Help the Problem?
After reading these e-waste statistics, we hope you have a greater appreciation of the need for proper e-waste recycling.
Many major retailers in the US and other countries accept e-waste for recycling regardless of where you purchased the product.
In addition, stores like Staples, Verizon, and BestBuy accept drop-offs, although it is always better to call ahead to confirm they will take your product for recycling.
Further reading:
- Deforestation Facts and Statistics
- Facts About Paper
- Paper Books vs eBooks Statistics, Trends and Facts
- United Nations
- WHO
- EPA
- Statista
- Earth911
- Elytus.com
- National Library of Medicine
- https://unu.edu/media-relations/releases/global-e-waste-surging-up-21-in-5-years.html#info
- https://market.us/report/e-waste-management-market...
- https://www.who.int/news/item/15-06-2021-soaring-e-waste-affects-the-health-of-millions-of-children-who-warns
- https://www.cbc.ca/radio/spark/412-1.4887497/the-world-s-largest-e-waste-dump-is-also-home-to-a-vibrant-community-1.4887509
- https://www.techrepublic.com/article/the-depressing-truth-about-e-waste-10-things-to-know/
- https://www.epa.gov/recycle/electronics-donation-and-recycling
- http://e-stewards.org/find-a-recycler/
- https://www.itu.int/en/ITU-D/Environment/Documents/Toolbox/GEM_2020_def.pdf
- https://www.statista.com/statistics/499952/ewaste-generation-worldwide-by-major-country/
- https://www.statista.com/chart/24291/e-waste-by-co...
- https://www.statista.com/statistics/1148086/ewaste...
- https://www.statista.com/chart/24291/e-waste-by-co...
- https://www.statista.com/statistics/499921/ewaste-...
- https://www.statista.com/statistics/1067081/genera...
- https://publicinterestnetwork.org/wp-content/uploa...
- http://sciencenetlinks.com/science-news/science-updates/greedy-computers/
- https://pubmed.ncbi.nlm.nih.gov/25104600/